6.Managing Quality
Exercise 7 . English Group Each team will explain two quality tools using the proposed Internet resources at Ch.4b Managing Quality Folder: Cambridge University, Sky Marks Tools and The Quality Toolbox.
- Scatter Plots
A scatter plot is a line graph with no line.It helps us to see in a clear way the relationship between two variables.
The Y axis is conventionally used for the characteristic whose behaviour we would like to predict in comparison with the X axes magnitude.
Warning: There may appear to be a relationship on the plot when in reality there is none, or both variables actually relate independently to a third variable.
- Flow Charts
Pictures, symbols or text coupled with lines, arrows on lines show direction of flow.Enables modelling of processes;
problems/opportunities and decision points etc.
Develops a common understanding of a process by those involved.
No particular standardisation of symbology, so communication to a different audience may require considerable time and explanation
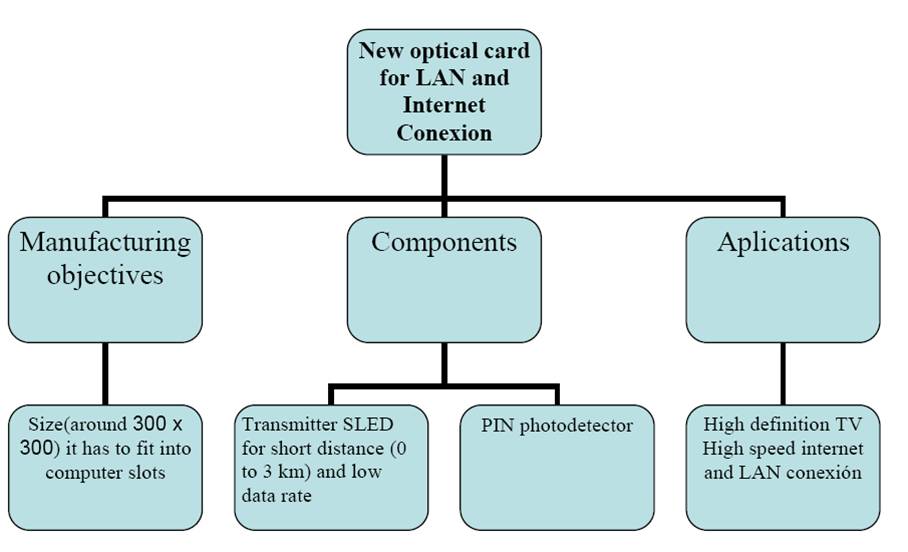
It´s an easy way to structure the design of our product and try to improve the quality of the method and the product.It´s also very useful for problem solving.
We used this method to design a new product in our project with DAS photonics.